Client Project Interactive Data Map
A mini web app to shows credit card and income stats by state.
Project Description
Our client’s content strategy includes creating a compelling pieces of content that earn powerful backlinks from the press. Adding visuals and valuable resources to their content helps to add value to their content and get the attention from the press that they’re looking for.
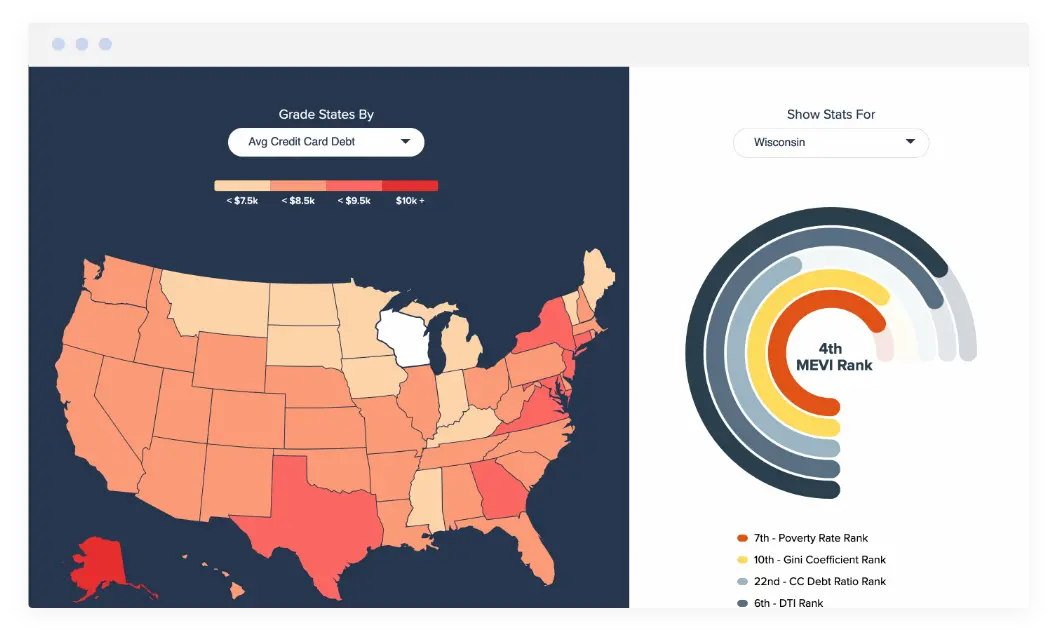
Here’s what we created for one of those pieces of content: an interactive map that shows credit card debt and income statistics by state as well as a scoped view for looking at additional metrics state by state.
Want to play with a demo? Check out the web app here.
Mobile responsive
There’s no point in creating a beautiful data visualization app if 80% of our visitors won’t be able to view it on their mobile devices. That’s why we were careful to consider mobile first and creative a user interface that emulates native UI elements – like the expandable drawer shown below.
Building the app
The web app is built on Vue.js. Vue is a popular JavaScript framework for web apps and it provides features that makes handling data and interactivity with that data a cinch.
Take the US map and the ability to fill in each state with a different color based that state’s average credit card debt. With Vue, this is pretty easy to do.
{
  "id": "CA",
  "name": "California",
  "cc_debt": 8144,
  "income": 71805,
  "credit_score": 670,
  ...
}
We start with JSON data that holds all of the stats for each state. Above we see California has an average credit card debt of $8,144 and an average household income of $71.8k per person.
In my web app’s template for the map we compile each US state and pass in a few metrics used for coloring.
<svg>
    <path
      v-for="state in stateData"
      :data-cc_debt="state.cc_debt_class"
      :data-income_class="state.income_class"/>
  </svg>
The <path> represents a single US state and i’m passing in a CSS class that was assigned based on the value and where it falls in a range. ie: low, medium, high based on thresholds that I set.
.metric-debt {
  [data-cc_debt="low"] {
    fill: $debt-low;
  }
  [data-cc_debt="med"] {
    fill: $debt-med;
  }
  [data-cc_debt="high"] {
    fill: $debt-high;
  }
  [data-cc_debt="xhigh"] {
    fill: $debt-xhigh;
  }
}
With a little CSS we can change the background color of each state.
